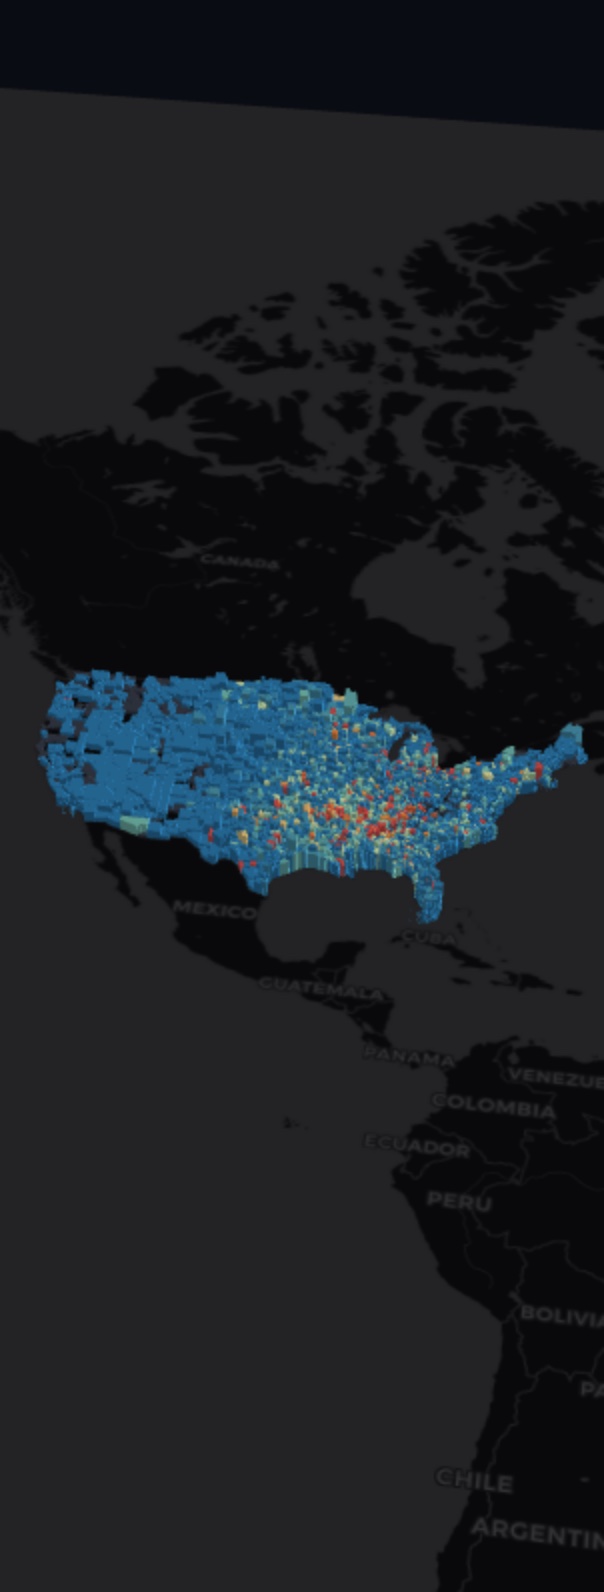
Every U.S. county rendered as a 3D bar. 73,834 tornadoes, 1950–2026.
Bar height is the number of tornadoes that struck each county under the current filters. Raise Strength to keep only EF3, EF4, or EF5 storms. Drag the year slider, or hit Play, to watch the record build across 76 years.
Color is a second, independent story you choose: how deadly the storms were (deaths per 100), how often they were violent, how wide, or how many struck after dark. The plains rack up the most tornadoes; the Deep South racks up the deadliest. The color rarely agrees with the height.
Counties with fewer than three tornadoes in view stay gray — too few to color honestly.
Source: NOAA Storm Prediction Center & NCEI Storm Events. Property-loss figures in the underlying data mix units across eras and are not shown here. Points placed by tornado touchdown location; 880 offshore/territory events fall outside the county map.